1. Downloading data
There are two ways to download the data provided from the NOWPAP Marine Environmental Watch (NMEW) website, one is to select a target image individually from the homepage and download a single file, and the other is to specify the criteria on the command line and download multiple files all at once.
To download an individual image, click the thumbnail image to be downloaded from the image search screen, right-click the displayed image, and save it. If you need individual image data, you can download the data in netCDF format by clicking the download icon![]() next to the image.
next to the image.
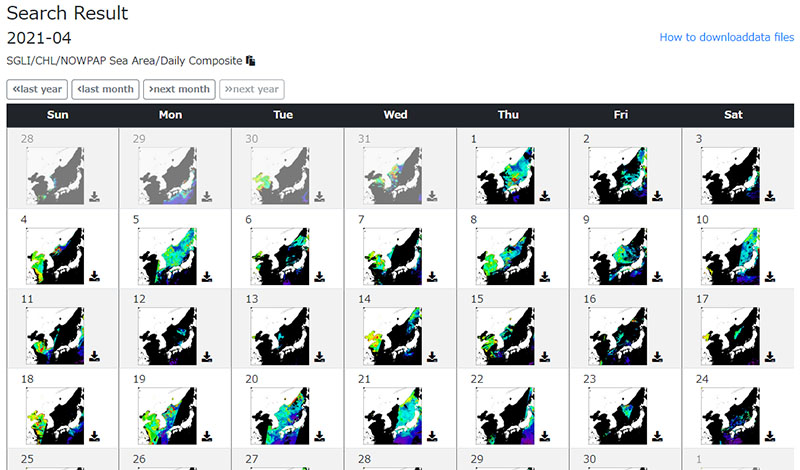
Figure 1. Daily composite Chlorophyll-a concentration observed by SGLI
Please refer to the link below for the sample code when you specify the criteria and download multiple images data .
<For Python users>
https://github.com/npec/NMEW.demos/blob/master/NMEW_bulk_download_demo.py
<Jupiter notebook users >
https://github.com/npec/NMEW.demos/blob/master/NMEW_bulk_download_demo.ipynb
2. Data analysis
The downloaded nedCDF format data can be analyzed with an environment that supports reading netCDF.
Here, we will show you the procedure for visualization and time series data analysis using Python, which is one of the programming languages.
Other software that handles netCDF format data includes SeaDAS, a water area remote sensing software developed by NASA, R, a statistical analysis software, QGIS, a geographic information system, and Windows Image Manager (WIM) from Wimsoft.
Preparation in progress
3.Case Studies
The analyzed data is utilized in various forms according to the purpose. Here, we will introduce an example of the use of satellite remote sensing in the assessment of eutrophication status within the framework of NOWPAP.
Eutrophication is a phenomenon in which water bodies such as the sea, lakes, and rivers shift from an oligotrophic state to a eutrophic state. In general, it leads to reduce biodiversity. Eutrophication is becoming widely recognized as a pollution and environmental problem, as it causes secondary phenomena such as occurrence of red tides and blue tides in extreme cases. Therefore, the Special Monitoring and Coastal Environment Assessment Regional Activity Center (CEARAC) of the NOWPAP is developing the NOWPAP Eutrophication Assessment Tool (NEAT), a tool for preliminary assessment of eutrophication, using time-series data of chlorophyll a concentration obtained by satellite remote sensing.
The NEAT was developed by Terauchi et al. (2018) as a NOWPAP project of the CEARAC, and is used to monitor the eutrophication status of the NOWPAP sea area (Fig. 2.).
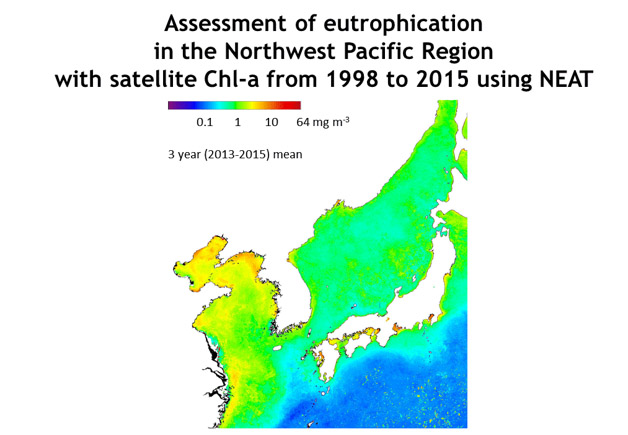
Figure 2. Preliminary evaluation of eutrophication status in NOWPAP sea area by NEAT
In the assessment of eutrophication by NEAT, the mean value for the recent 3 years in the assessment period is computed from the monthly average chlorophyll a concentration obtained by satellite remote sensing, then the threshold value is applied to divide into high and low chlorophylla concentration sea areas. The reference value used in the NEAT is 5 mg -3, the moderate lower limit indicated by Bricker et al. (2003), which was discussed and agreed by consensus among researchers in NOWPAP member countries. Next, from the monthly average data of the assessment period, the annual chlorophyll a maximum value for each year is calculated, and the increasing / decreasing trend of that value is tested by a statistical method, then it is divided into three categories: increasing tendency, decreasing trend, and no increase / decrease trend. Finally, the assessment area is classified into 6 types by combining the results of the chlorophyll a concentration level (high, low) and the increasing / decreasing trend (increasing trend, decreasing trend, no increase / decrease trend).
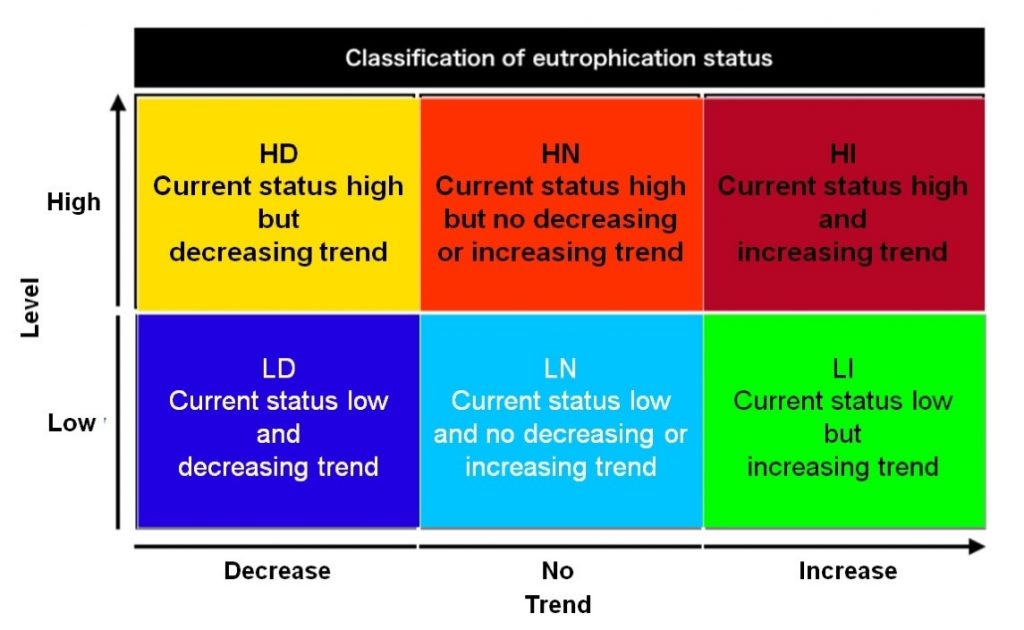
Figure 2. Six classes of eutrophication status used in the NEAT
CEARAC regularly organizes expert meetings for eutrophication assessment to further improve the NEAT. In addition, the NEAT is expected to be used by the United Nations Environment Program as a tool for monitoring the achievement status of the Sustainable Development Goals “SDGs” 14 “Let’s protect the abundance of the sea” of the United Nations Environment Program.
The time-series chlorophyll a concentration data used in NEAT is based on the comparison and evaluation work of field observation data and multiple ocean colour remote sensing sensors under the work of promoting the NOWPAP activity of Ministry of the Environment, Japan. The data set is processed by a regionally tuned algorithm for to fit the characteristics of the NOWPAP sea water. Please refer to this page for the activities to promote the Northwest Pacific Ocean Action Plan.
4.Introduction to a research project to promote the NOWPAP in Toyama Bay
4.1. Overview
This project aims at promoting use of remote sensing data in the NOWPAP by building a joint research team with Nagoya University, Toyama National College of Technology, and Toyama Prefecture, lead by the Northwest Pacific Region Environmental Cooperation Center (NPEC) since 2003 supported by the Ministry of the Environment, Japan.
In order to evaluate the usefulness of remote sensing as an environmental monitoring tool, the NPEC is testing existing and new algorithms to estimate chlorophyll-a concentration data in Toyama Bay as a case study site. For this purpose, the NPEC has been conducting surveys to collect filed data to evaluate satellite data (Figure 4). Furthermore, the NPEC is trying to understand the actual condition of the relationship between the behavior of phytoplankton and water quality in Toyama Bay.
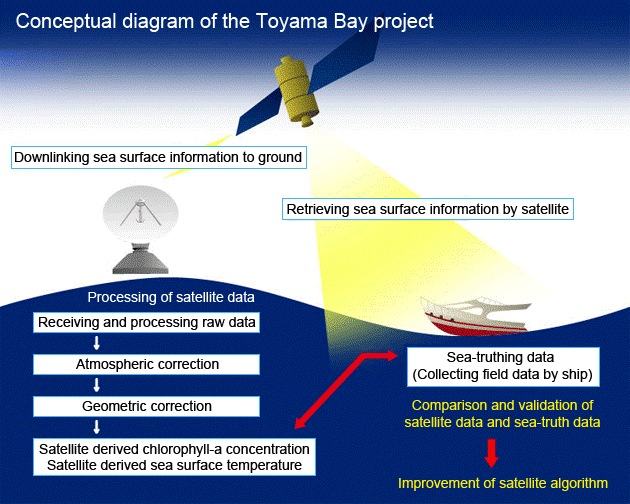
Figure 4. Toyama Bay project conceptual diagram
4.2. Survey stations and observation parameters
Observation stations in this survey is shown in Figure 5. Water samples at at surface layer (0 m) and subsurface layer (0.5 m, 2 m) are collected about four times a year for analysis.
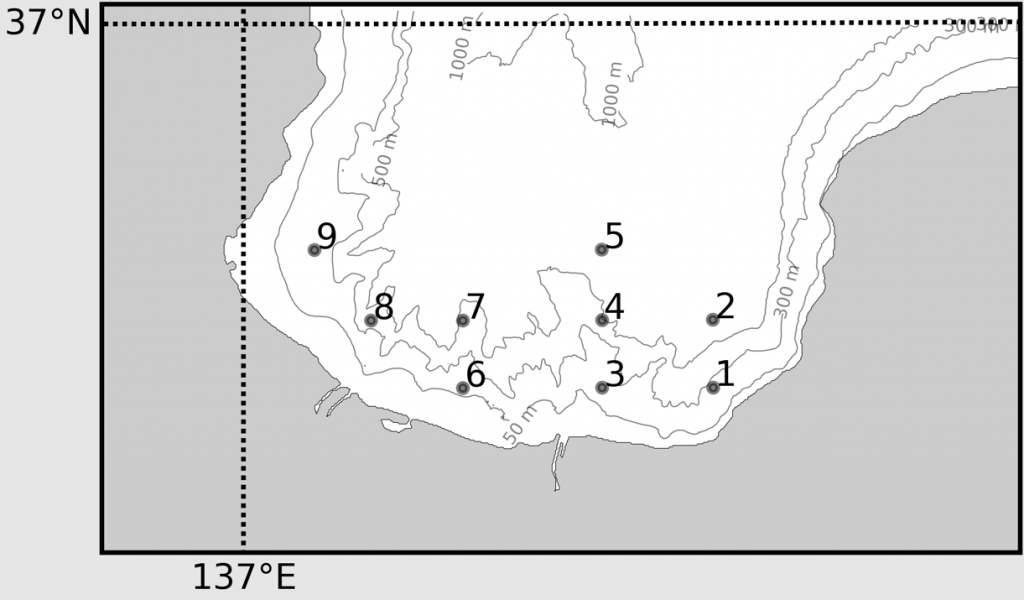
Figure 5. Observation points in Toyama Bay
At these stations, suspended substances (SS), colored dissolved organic matters (CDOM), chlorophyll-a concentration (Chl-a), dissolved inorganic phosphorus (DIP), dissolved inorganic nitrogen (DIN), transparency, dissolved oxygen (DO) and salinity. Figure 6 shows the data acquisition period and the number of acquired data for each observation item.
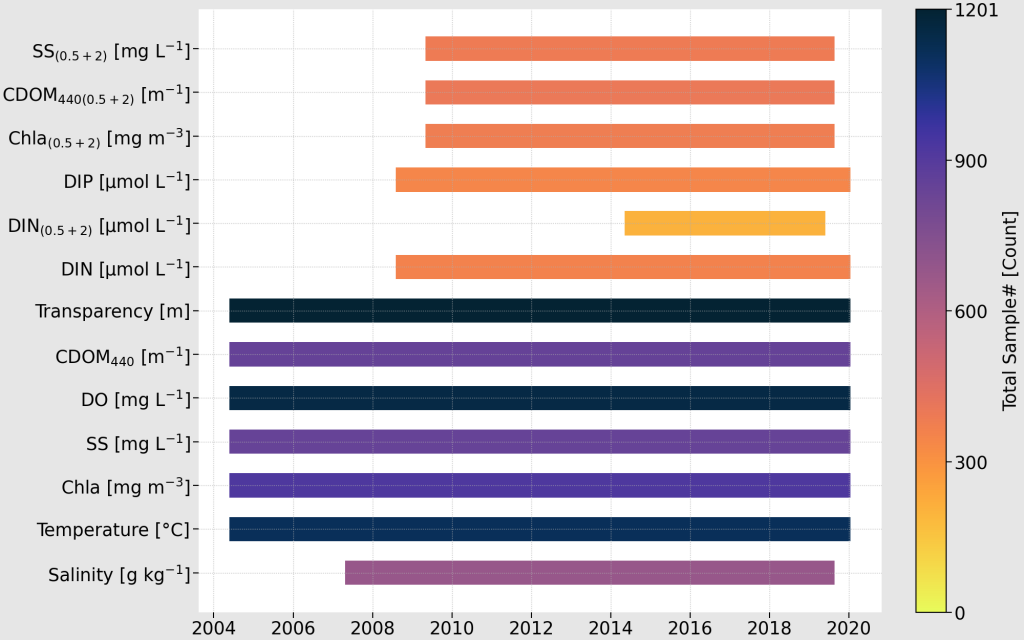
Figure 6. Data acquisition period and list of acquired data in Toyama Bay. Colors indicated number of samples collected.
* Observation items (0.5 + 2) and 440 indicate values for mixed samples with depths of 0.5 m and 2 m and wavelengths of 440 nm, respectively.
As an example of other data utilization, we will introduce an interview article with users of the Pan-Japan Sea Marine Environment Watch.
5. Interview
“For conservation of marine environment”


6. Papers
This is a list of papers using data provided by the Marine Environmental Watch Project.
Terauchi G, Maúre E R, Yu Z, Wu Z, Kachur V, Lee C and Ishizaka J (2018) Assessment of eutrophication using remotely sensed chlorophyll-a in the Northwest Pacific region Proc. SPIE 10778, Remote Sensing of the Open and Coastal Ocean and Inland Waters, 107780H (24 October 2018); https://doi.org/10.1117/12.2324641
Motoki Terauchi, Keio Maeda (2016) Evaluation of eutrophication by satellite remote sensing and current status and issues of seagrass bed mapping in the northwestern Pacific region, Coastal Ocean Studies, 2016-2017, Vol. 54, No. 1, p. 29-42 , Release date 2020/02/12 , Online ISSN 2434-4036, Print ISSN 1342-2758, https://doi.org/10.32142/engankaiyo.54.1_29
Terauchi G, Tsujimoto R, Ishizaka J and Nakata H (2014) Influence of river dicharge on seasonal and interannual variability of remotely sensed chlorophyll-a concentration in Toyama Bay, the Sea of Japan La mer 52 (3)
Terauchi G, Tsujimoto R, Ishizaka J and Nakata H (2014) Preliminary assessment of eutrophication by remotely sensed chlorophyll-a in Toyama Bay, the Sea of Japan Journal of Oceanography, 70(2), pp175-184. doi: 10.1007/s10872-014-0222-z寺内ら 2016
Terauchi G, Ishizaka J (2007) Eutrophication monitoring by satellite remote sensing in Toyama Bay. Bull Coast Oceanogr 45:43-49. (In Japanese with English abstract)
Yamada M, Otsubo M, Tada K, Nakano Y, Matsubara T, Iida N, Endo Y, Montani S (2016) Species composition of the genus Skeletonema (Bacillariophyceae) in five Japanese coastal waters over the subtropics from the subarctic zone, NIPPON SUISAN GAKKAISHI, 83:25-33. (In Japanese with English abstract) https://doi.org/10.2331/suisan.16-00040