Landsat is a series of earth observation satellites that has been launched by the National Aeronautics and Space Administration (NASA). The Landsat mission is to observe the global environment by optical sensors in several wavelengths. The most recent Landsat satellite is Landsat-7. There have been a great many images collected since the first Landsat was launched in 1972. These images are utilized not only in general science but also agriculture, city planning and national security. The United States Geological Survey (USGS) announced the release of the Landsat data without charge in 2009. To allow analysis of satellite data, various kinds of free software tools, such as QGIS and so on, are available. This website provide guidance to obtain and analyze free Landsat data with a case study conducted in Toyama Bay, a semi enclosed bay in Japan. Please refer to the following “Landsat Data Analysis Manuals” for more information.
Handbook for detecting land cover change with Landsat data archive (in English) (Uploaded on Jan 25, 2011)
DOWNLOAD
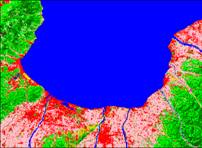
The disappearance of the marine biological diversity along the coastline is a problem caused by the influence of human activities on the land. Therefore, understanding changes in land use and land cover quantitatively and objectively is essential for the marine environmental monitoring. Use of the satellite remote sensing is expected to see those land-sea interactions. Our case study here presents changes of land cover in Toyama Bay coastal area by comparison of 2 Landsat images observed in 1972 and 2000.
 |
  |
| Fig.1 Supervised classification result of land cover by the Landsat satellite data (taken on 5 Oct 1972) |
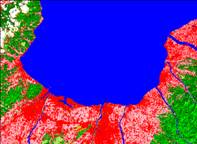
Fig.2 Supervised classification result of land cover by the Landsat satellite data (taken on 5 Oct 2000) |
Table.1 Land cover changes around Toyama Bay coastal area
| 1972 Year | 2000 Year | Changes (based on 1972 Year) |
|
|---|---|---|---|
| Water(km2) | 975.55 | 905.72 | -69.83 |
| Paddy field(km2) | 349.19 | 262.37 | -86.82 |
| City area(km2) | 218.08 | 445.27 | 227.18 |
| Field(km2) | 29.67 | 12.13 | -17.54 |
| Golf course(km2) | 0.00 | 5.68 | 5.68 |
| Bare land(km2) | 3.24 | 3.44 | 0.20 |
| Broadleaf forest(km2) | 248.35 | 98.35 | -150.00 |
| Needle leaf forest(km2) | 143.82 | 207.24 | 63.42 |
| Others(Cloud area)(km2) | 0.00 | 26.10 | 26.10 |
| Total(km2) | 1967.90 | 1966.29 | -1.61 |