Northwest Pacific Region Environmental Cooperation center has developed a new methodology to preliminarily assess marine coastal eutrophication by remote sensed chlorophyll-a (satellite Chl-a). The result of preliminary eutrophication assessment in the Northwest Pacific region by satellite Chl-a is available from here.
It is essential to collect long-term and high-quality data for assessing eutrophication status with satellite Chl-a. Since the success of the Japanese Ocean Color and Temperature Sensor (OCTS) in the satellite ‘ADEOS’, launched by the National Space Development Agency of Japan (NASDA) (currently, the Japan Aerospace Exploration Agency: JAXA) in 1996, regular observation of Chl-a by satellite remote sensing has been possible. ADEOS itself had a life as short as 10 months; however, it recorded high-quality marine observation data with high frequency and resolution (1 x 1 km). Then, the National Aeronautics and Space Administration (NASA) launched the Sea-viewing Wide Field-of-view Sensor (SeaWiFS) in 1997, and Moderate Resolution Imaging Spectroradiometer (MODIS) in 1999 and 2002 respectively. Today, time-series ocean color data is available for more than a decade. Unfortunately, the data quality of MODIS on board the satellite ‘TERRA’ in 1999 is considered rather low; therefore, OCTS on ADEOS, SeaWiFS on Orbview 2 and MODIS on Aqua were used for this preliminary assessment (See Table 1). For data processing algorim, the standard NASA Ocean Color 3 and 4 algorithms were applied as they are globally used, Satellite Chl-a is known to change radically once every few days; thus, it was decided to remove stripe noise of daily basis by developing monthly mean of the data and observing the trend. For the period when SeaWiFS and MODIS overlap their observations, each data was averaged and synthesized. The target sea area of this preliminary assessment was the Northwest Pacific Region (the NOWPAP region), including the Sea of Japan and part of the Yellow Sea.
| Sensor and Satellite | OCTS on ADEOS SeaWiFS on Orbview2 MODIS on Aqua |
| Data processing algorism | standard NASA OC3 algorism standard NASA OC4 algorism |
| Duration | Jan. 1997 ~ Dec. 2009 |
| Unit of data | monthly mean data |
| Geographical coverage | 20-50ON, 115-150OE |
For identification of eutrophication status, satellite Chl-a was classified into the 6 categories by the combination of its level and trend, following the Common Procedures (Fig. 1).
The overall mean of the 13-year data (1997-2009) was used to divide the study area into “High” or “Low” Chl-a area, by the Chl-a level more than 5 ug/L referring to the lowest limit of the Medium Chl-a condition(5-205 ug/L) suggested by Bricker et al. (2003).The trend of annual Chl-a maximum in monthly mean Chl-a and its significance were estimated at pixel wise by the Sen Slope test at 90% confidence level, and then, the studied area was divided into “Increase trend”, “Decrease trend” or “No trend.”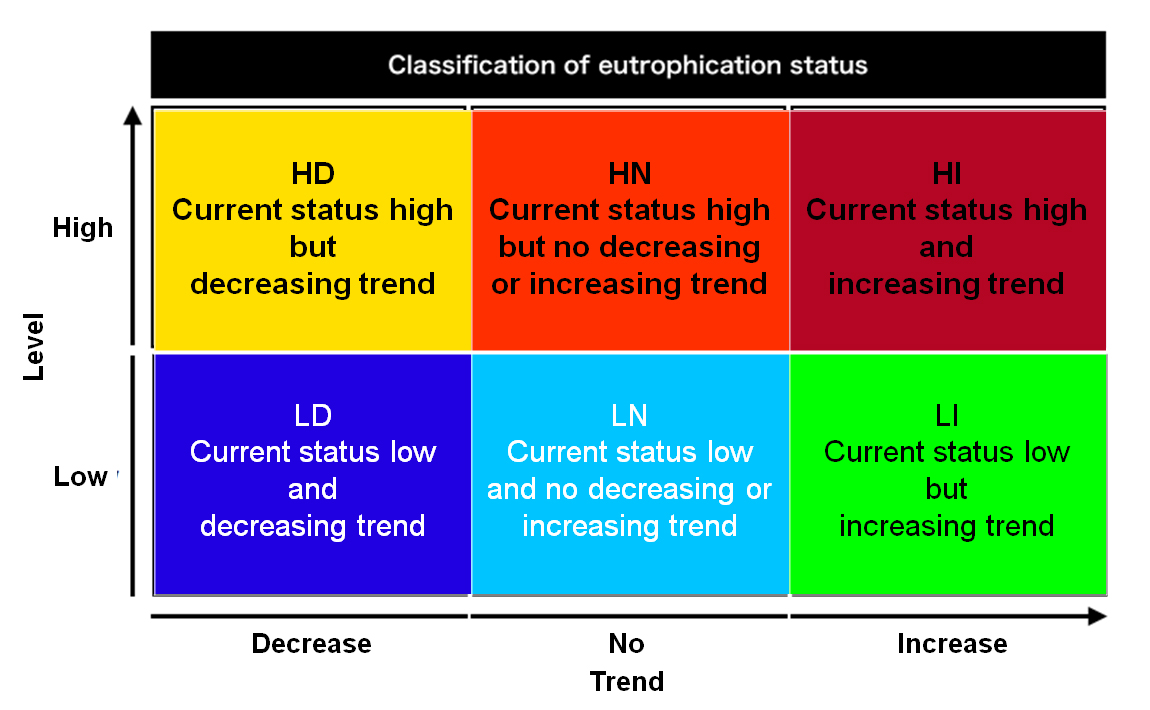
(2) Results and Conclusions
Figure 2 shows the overall mean satellite Chl-a in 13-year time-series (1997-2009). This data divides the sea area into two ? either higher or lower than 5 ug/L. As a result, it was clearly shown that the areas with higher Chl-a concentration were distributed along the coastal waters (Fig. 3).
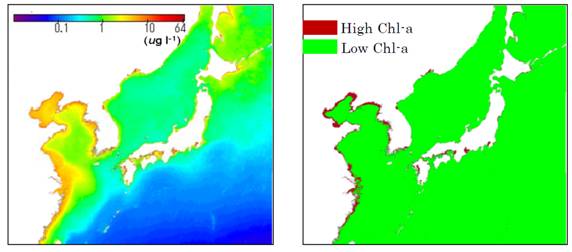
| Fig. 2. 13-year overall mean image of satellite Chl-a | Fig. 3. Sea area with higher Chl-a(<5 ug/L)(brown) and lower Cha-a(>5 ug/L)(light green)) |
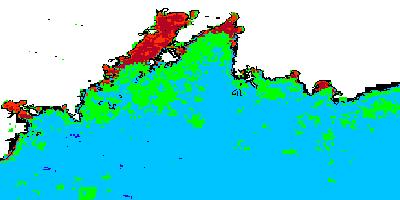
Figure 4 shows the trend of annual Chl-a maximum in monthly mean Chl-a from 1997 to 2009 (blue: decrease, red: increase, white: no trend). Based on this image, the NOWPAP sea area was divided into ‘Increase’, ‘Decrease’ and ‘No trend’ (Figure 5).
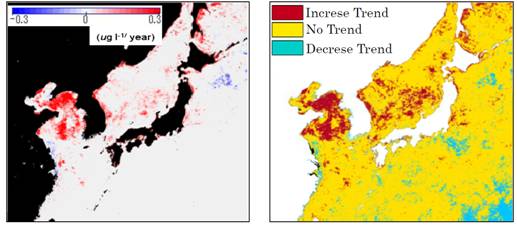
| Fig. 4. Trend of Chl-a concentration by each pixel (blue: decrease , red: increase, white: no trend) | Fig. 5. Sea area with Chl-a increase (red), Chl-a decrease (light blue) and no increase or decrease (yellow) |
Based on the results above, the NOWPAP region was classified into the 6 categories of the Common Procedures and shown with different colors (Fig. 6). Then, the model areas for the eutrophication assessment case study in each NOWPAP member state were cut out respectively (Fig. 7).
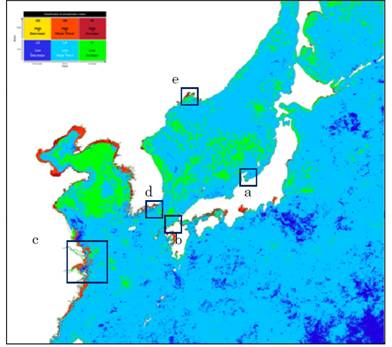
Fig. 6. Result of the preliminary assessment of eutrophication status by satellite data in the NOWPAP region
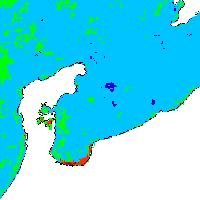 a. Toyama Bay Area, Japan |
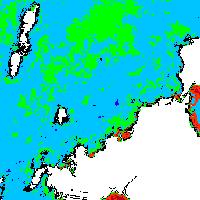 b. Northwest Kyushu sea area, Japan |
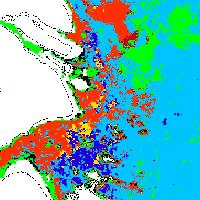 c. Yangtze River Estuary and adjacent area, China |
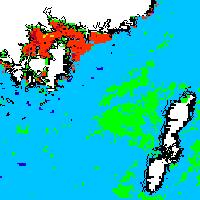 d. Jinhae Bay, Korea |
 e. Peter the Great Bay, Russia |
|
| Fig. 7. Results of preliminary assessment of eutrophication status in each model sea area. | ||
| You can download and map the above images on the Google Earth(TM) | ||
Among the 6 classification categories of eutrophication status, 4 categories (HI: High- Increase, HN: High-No trend, HD: High-Decrease, and LI: Low-Increase) are considered either eutrophication is progressing or eutrophication is possibly occur in the future.
To test validity of the results obtained from the preliminary assessment of eutrophication status by satellite Chl-a concentration, they were compared to those of eutrophication assessment conducted in Toyama Bay based on the Common Procedures. There were some similarities between the two results. For example, increasing trend is identified in total nitrogen (TP) in the Jinzu River, which is flowing into the inner part to the eastern coast of Toyama Bay, where were classified either ‘HI’ or ‘HN.’ Also, the mean value of winter DIN concentration of the recent 3 years (2007-2009) exceeded the reference condition in several points in the bay. Thus, the in-situ observation data confirmed the validity of the results of the preliminary assessment.
In this analysis, as mentioned above, standard NASA OC3 and 4 algorisms were used. However, it is pointed out that their estimation quality is not so high in turbid water such as Changjiang (Yangtze) River eutuaries. Thus, new algorisms have been under development to improve accuaracy of satellite Chl-a in turbid waters. Another consideration was that this analysis didn’t refer to OCTS data quality information for the purpose of collecting coastal area data as much as possible. However, in the future, it is necessary to develop a map of the preliminary assessment of eutrophication status, referring to data quality information and to test its validity.