Interview to Professor Victor Shinichi KUWAHARA
 Prof. Victor KUWAHARA Department of Environmental Science and Engineering, Graduate School of Science and Engineering, Soka University <Major Research Theme> Apparent and Inherent Optical Properties in Marine Ecosystems |
NPEC and Dr. Kuwahara’s Laboratory of Biological and Optical Oceanography (LaBO2) are collaborating on two research proposals under the 4th Research Announcement on the Earth Observation by Japan Aerospace Exploration Agency (JAXA), specifically on “Monitoring Coastal Ecosystem Climate Change: Integrating GCOM-C and in situ Observation through AI science”(LaBO2) and “Development of regional indicator for SDGs 14.1.1a, index of coastal eutrophication with GCOM-C SGLI”(NPEC).
| What are main research themes pursued in your laboratory? | |
 |
Our research has two major themes. One is the long-term marine environmental observation at “Station M,” a fixed point off Manazuru, Kanagawa Prefecture. This is the site where we have continuously conducted monthly water quality observations for nearly 30 years since I was a master’s student. In fact, we have accumulated data over 35 years by this monthly monitoring to date. |
| Thirty-five years is surprisingly a long period of time. Please explain the work in more detail. | |
|
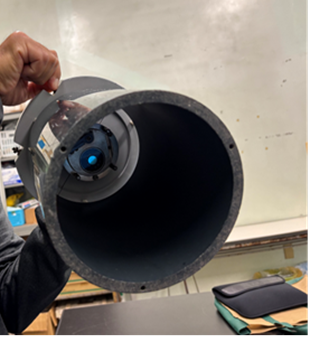
We observe salinity, sea surface temperature (SST) and chlorophyll-a concentration using a Conductivity, Temperature and Depth profiler (CTD) system. We also measure underwater radiance and analyze nutrients and Inherent Optical Properties (IOPs) from water samples. In particular, with the PRR800 profiling reflectance radiometer equipped with a stabilizer and float for attitude control, we can obtain highly accurate QA (Quality Assurance)/QC (Quality Control) data. In addition, we measure the fluorescence characteristics of the phytoplankton with a multi-wavelength excitation fluorometer and estimate biomass and community composition. These in-situ data are also indispensable for the calibration and validation of JAXA’s GCOM-C/SGLI satellite data. |
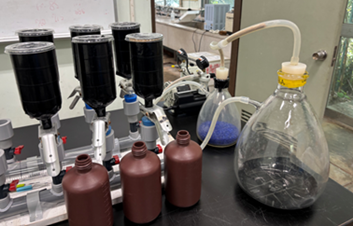
Apparatus for sample water analysis
PRR800
Multi-wavelength excitation fluorometer
| This is truly the integration of satellite data and in-situ observations. What is the other theme of your research? | |
|
The other one is a critical issue: marine plastic pollution, which we call the “Ocean Hitchhikers Project (OHP).” The target sea area is the Southeast Asian region and we investigate the potential of marine plastic debris as a vector for transport of harmful microorganisms. |
| It’s interesting that plastic debris can help transportation of harmful microorganisms. What exactly do you and your team do in this research? |
|
|
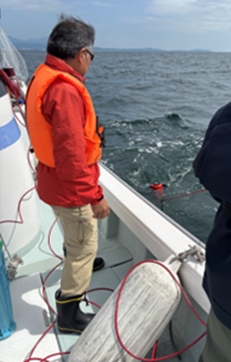
The goal is to quantify existing marine plastic debris and harmful microorganisms attached to them, and to reveal the correlation between the types of plastic and microbial species and their temporal variability. Our research includes collection of plastics from the ocean, and observation of marine plastics from ships, and monitoring washed-up plastics using cameras and drones. Then, we conduct genetic analysis of microorganisms which are attached to collected plastic debris. We also experiment microbial colonization using specific plastics being submerged. It is necessary to improve the accuracy of analysis using machine learning in order to advance our study. |
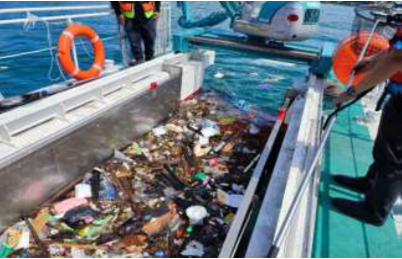
Collection of plastics from the ocean
Interview with LaBO2 graduate students
Robel M. Ashenafi (D1)
Brittany A. Chang (M2)
Mia L. Casteillo (M1)
 |
Mr. Ashenafi, what is your current research subject? |
Robel |
My research focuses on the “Spatio-Temporal Variability of Sea Surface Temperature (SST) and Chlorophyll-a (Chl-a), and their correlation with environmental parameters in the coastal waters of Sagami Bay, Japan.” The goal is to reveal long-term changes of relevant parameters in the coastal areas of Sagami Bay. |
|
What kind of data are you specifically using for your analysis? |
Robel |
I primarily use satellite remote sensing data from MODIS-Aqua and GCOM-C/SGLI. In addition, I use meteorological data, bathymetric data, and data from the “Marine Environmental Watch System” (hereinafter referred to as Watch System) provided by NPEC. |
|
We appreciate for your using data from the Watch System. For what purpose, and specifically, what data are you using? |
Robel |
From the Watch System, I obtain data related to the time-series changes of SST and Chl-a in Sagami Bay. I find them particularly useful for analyzing long-term trends, seasonal variations, and anomalies. By combining multiple data from difference sources, it is possible to conduct more reliable analyses. |
|
What kind of benefits can you get by using data from the Watch System? |
Robel |
As is basically true for remote sensing techniques, the greatest advantage is obtaining data of a wide spatial coverage. They allow efficient monitoring of wide areas, which would be difficult in in-situ observations. Also, a large number of historical data are available, making it extremely effective for understanding long-term trends. In particular, as the Watch System has data of the sea areas around the Japanese archipelago including Sagami Bay, my research target and it continues uploading newer data, it is now an essential tool to advance my research. Being able to access data with less time and money is also a big advantage. |
|
Are there any findings in your research so far? |
Robel |
Our analysis has revealed that overall SST in Sagami Bay generally shows an increasing trend, while Chl-a concentration shows a decreasing trend. SST reaches its maximum in August and minimum in February, and the inner Sagami Bay tends to have lower SST than Sagami Nada (outer bay). Chl-a blooms (phenomenon of drastic increase of Chl-a concentration) are observed in spring and summer, and Sagami Bay shows more than double the Chl-a concentration of Sagami Nada in some months. This suggests strong impacts of climate change and human activities on the marine environment, but further detailed analysis is needed. |
| Brittany and Mia, what themes are you interested in? | |
Brittany |
I’ve been mapping seagrass beds in the coastal area of Malaysia by using Seagrass Mapper, the cloud-based seagrass mapping tool provided in the Watch System. I’m interested in assessing water quality in seagrass beds using ocean color remote sensing data and revealing its relationship with the distribution of seagrass beds. |
Mia |
I’ve just started my research, and I’m intrigued by eutrophication assessment in marine waters. I understand that the “Global Eutrophication Watch (GEW)” tool developed by NPEC for assessing eutrophication can utilize data that has been tuned to match the characteristics of specific marine areas. I’m from the Westcoast of the U.S. where harmful algal blooms (HABs) have occurred. So, I’d like to learn about the eutrophication assessment related to HAB, using GEW. |
After the Interview: Professor Kuwahara’s laboratory has been engaged in a wide range of researches, from local topics such as the long-term repetitive observations off Manazuru to global issues like plastic pollution in order to understand the marine environment more deeply and conserve it effectively. In their study, the laboratory members’ active utilization of the Marine Environmental Watch System is very encouraging for NPEC. NPEC will work on enhancement of the Watch System to be utilized in more cutting-edge research projects.
(Interview conducted from December 2024 to May 2025)
(Interview conducted from December 2024 to May 2025)